What is The Scatterplot Data Generator?
Spoiler Alert, Its Your Lifesaver for Creating Custom Dataset Visualizations

Introduction
Picture this: It's 3 AM, you're on your fifth cup of coffee, and you're staring at your screen thinking, "If only I had the perfect dataset to test this clustering algorithm..." Trust me, I've been there – we've all been there. As a data engineer who's spent countless nights wrestling with algorithms that just won't behave (much like my neighbor's cat), I've discovered a tool that's become my secret weapon: the Scatterplot Data Generator.

In this post, we'll explore what this magical tool is, why it's a game-changer for data scientists and engineers, and how it can save you from those late-night data hunting expeditions.
What is The Scatterplot Data Generator?

Scatterplot Data Generator is a web-based tool that lets you literally draw your data points into existence. Think of it as MS Paint meets data science (minus the questionable artistic results we all created in the '90s). It allows users to draw points of different colors on a coordinate system, which are then converted into actual numerical data that you can use for machine learning models, testing, or educational purposes.
Why is Scatterplot Data Generator Important?

Let me tell you a story that might sound familiar. Last year, I was working on a multi-class classification model that needed very specific data patterns to test edge cases. After hours of searching through Kaggle and various datasets (and possibly losing a bit of my sanity), I realized I was doing it the hard way.
Simplest Use Case for Scatterplot Data Generator

Visual Pattern Recognition:
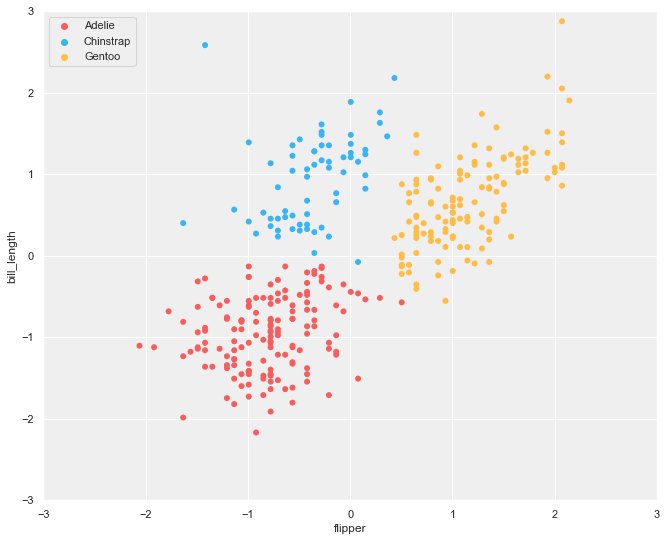
The tool shows two distinct plots: one with color-coded points (blue and red) and another with black points
This helps learners understand how clustering algorithms identify and separate data points into groups based on their spatial relationships
Interactive Learning Features:
The interface has color selection options (Blue, Red, Green)
A "Reset" button to start fresh
"Download CSV" functionality to export the data
These features allow hands-on experimentation with different data patterns
Educational Benefits:
Learners can create custom data distributions to test clustering scenarios
The tool demonstrates how points that are closer together tend to form clusters
The right-side plot shows how raw data looks before classification/clustering
The left-side plot shows how clustering algorithms might separate the data into distinct groups
Practical Applications:
Users can generate synthetic datasets for testing clustering algorithms like K-means or DBSCAN
They can experiment with different data patterns and see how clustering algorithms might perform
The CSV export feature lets them use the generated data in actual ML tools and frameworks
This tool essentially bridges the gap between theoretical understanding and practical application in machine learning clustering concepts.
Real Examples of Scatterplot Data Generator in Action
1. The Classification Conundrum
Picture this: I was working with a peer who couldn't understand why their beautiful linear classifier was failing miserably. Rather than diving into complex math, I fired up Scatterplot Data Generator and drew a simple XOR pattern – you know, that classic "cross" shape that makes linear classifiers cry themselves to sleep. Five minutes of interactive demonstration showed what would have taken an hour to explain with equations. The best part? They immediately started experimenting with their own patterns, creating increasingly diabolical datasets to break various classifiers. It's all fun and games until someone creates a spiral pattern!
2. The Edge Case Emergency
It was Sunday night (because production issues never happen on a Tuesday afternoon, right?), and our anomaly detection system was having false positives. We needed to test edge cases, and fast. Using Scatterplot Data Generator, we created datasets with specific outlier patterns that mimicked our production scenarios. Within an hour, we had a suite of test cases that would have taken days to find in real data. The best part? We could tweak the patterns in real-time as we discovered new edge cases. Our Monday morning post-mortem turned into a "look how we nailed it" presentation!
Workflows for Scatterplot Data Generator
Tips and Reminders for Using Scatterplot Data Generator
1. Plan Your Pattern
Before diving in, spend five minutes sketching your intended pattern. Trust me, I learned this the hard way after creating what I thought would be a perfect Gaussian distribution but ended up looking more like my failed attempt at drawing a cat. Quick tip: Use graph paper for your sketches – your coordinates will thank you later! ###
2. Save Everything
I cannot stress this enough: Save. Your. Work. Name your files descriptively (not "test1_final_final_REALLY_FINAL.csv"). Keep both the visual and the data. Document your patterns. I once spent three hours recreating a "perfect" dataset because I forgot to save the original. Learn from my pain!
Conclusion
Just as every great artist needs their canvas, every data scientist needs their tools. Scatterplot Data Generator bridges the gap between imagination and implementation, between "I wish I had this data" and "I created exactly what I needed." Whether you're a seasoned data scientist battling with edge cases, a teacher illuminating the mysteries of machine learning, or a beginner trying to understand why your neural network has trust issues, this tool transforms the abstract into the tangible. Remember: in a world where data is the new oil, being able to generate exactly what you need makes you not just a data scientist, but a data artist. And sometimes, the best datasets are the ones we draw ourselves – even if they occasionally end up looking like abstract art!
P.S. Let's Build Something Cool Together!
Drowning in data? Pipelines giving you a headache? I've been there – and I actually enjoy fixing these things. I'm that data engineer who: - Makes ETL pipelines behave - Turns data warehouse chaos into zen - Gets ML models from laptop to production.
If you find this blog interesting, connect with me on Linkedin and make sure to leave a message!